

Map Room
Build a Map in the Map Builder

Jump right into the data. Build customized state, county, and ZIP Code-level maps from hundreds of indicators on health factors, health outcomes, and population demographics sourced across multiple sources of data. Learn how to get started with the Map Builder .
View Examples
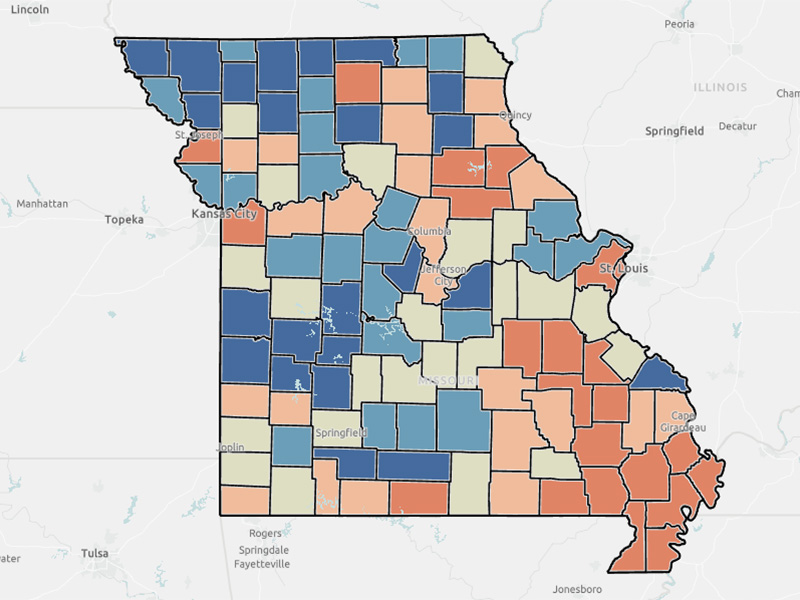
Which conditions affect your county compared to the rest of the state?
The percent of live births with low birth weight (< 2,500 grams) ranges from 3.5% in Atchison County to 12.6% in St. Louis City. Understanding where these disparities occur, and for which conditions, is critical to understanding and improving community health.
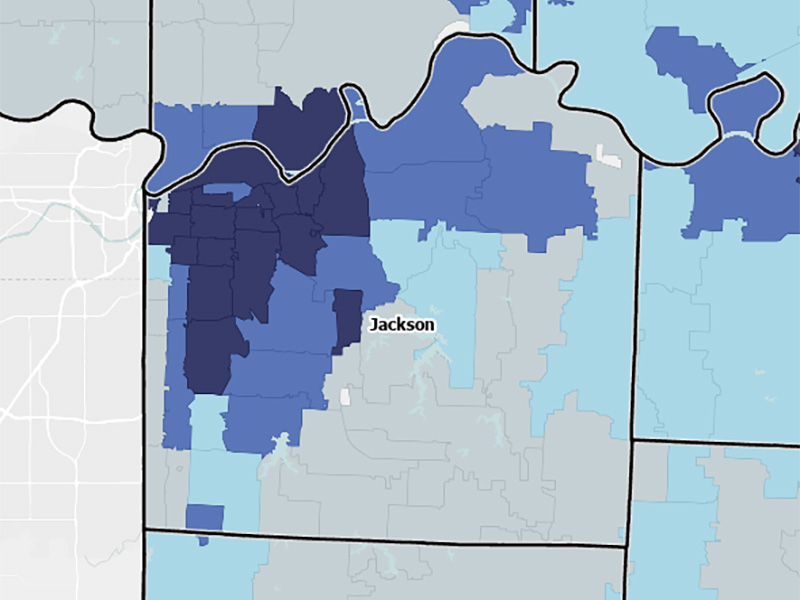
Where is the health divide within your county?
The rates of hospital-diagnosed low birthweight births per 1,000 population under 5 years old range across Jackson County ZIP Codes from 28.6 in Kansas City-Greenway Fields (64113) to 311.11 in Kansas City/Unity Village (64139), a 10-fold disparity in low birthweight rates. Identifying the communities within counties that are driving high rates of illness can help target resources to maximize the effectiveness of community health improvement interventions.
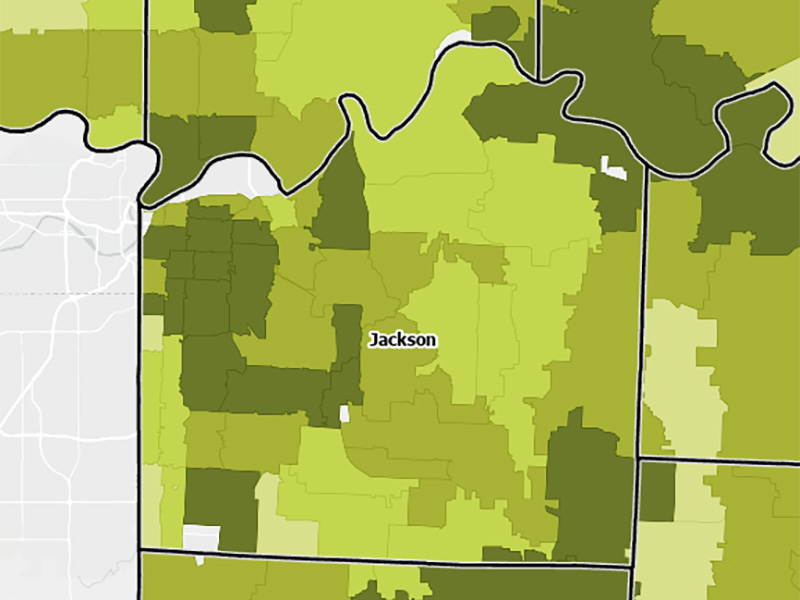
What are the upstream factors determining downstream health outcomes?
Using substances like tobacco during pregnancy is a major risk factor for having a baby with low birth weight. Many ZIP codes with a high prevalence of low birthweight births also have a high prevalence of hospital-diagnosed smoking in Jackson County. Identifying and understanding the underlying drivers of health outcomes increases the likelihood of successful prevention efforts.